Auditing SHAP Explanations Against Known Failure Mechanisms in Predictive Maintenance
© 2026 IEEE. Personal use of this material is permitted. Permission from IEEE must be obtained for all other uses, in any current or future media, including reprinting/republishing this material for advertising or promotional purposes, creating new collective works, for resale or redistribution to servers or lists, or reuse of any copyrighted component of this work in other works. The linked PDF is the accepted version of a paper to appear in the 2026 IEEE International Conference on Big Data (BigData).
Abstract
Machine learning models are widely used to predict equipment failures in industrial systems, but accurate predictions do not guarantee that models rely on features consistent with physical failure mechanisms. Although explainable artificial intelligence methods identify influential features, whether these explanations align with documented failure mechanisms is rarely tested statistically. To address this gap, we propose a mechanism-level statistical audit that evaluates whether feature attributions concentrate on mechanism-relevant features, distinguish among failure mechanisms, and reveal potentially misleading feature reliance. Three complementary statistics are evaluated against reference distributions generated by retraining models on shuffled labels. Experiments on the AI4I 2020 benchmark show evidence of attribution alignment for three of four documented failure mechanisms with engineered features, two of which remain aligned in every prespecified input and attribution configuration. Additional evaluations on laboratory bearing recordings and simulated industrial process data demonstrate the applicability of the framework across different settings. Controlled shortcut experiments show that models can maintain high predictive performance while relying on misleading features. A grouped statistic detects shortcuts spread over a few features, although weaker shortcuts may not be detected. Audit conclusions are also sensitive to the choice of explanation method and reference distribution. Overall, the proposed framework enables systematic statistical evaluation of explanation–mechanism alignment, while recognizing that attribution agreement does not establish physical correctness.
Contributions
- A mechanism-level statistical audit with alignment and outside-set decisions, including a grouped outside-set statistic \(C^{(3)}_m\) for reliance spread over a few features, a retrained shuffled-label reference, and a mechanism-specificity reference.
- A prespecified protocol that reports each verdict with its sensitivity to input features and attribution reference, plus cross-explainer agreement; controlled shortcut experiments and calibration on independent generated runs measure detection and false-flag rates.
- Evaluation across AI4I 2020, CWRU laboratory bearings, and simulated Tennessee Eastman data, including raw-feature, grouped, temporal, and placebo checks, with reproducibility materials.
Method
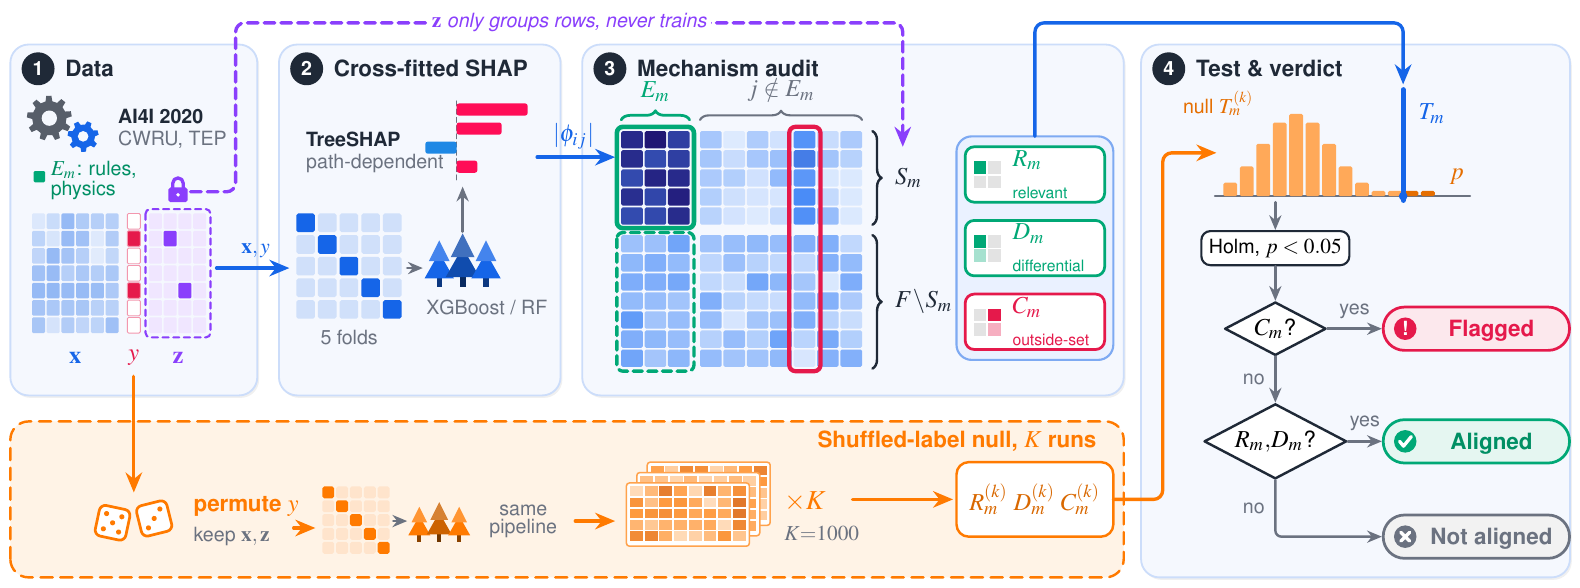
A classifier \(f\) is trained on the inputs \(x_i\) and the overall failure label \(y_i\) only. For each mechanism \(m\), domain knowledge fixes a set \(E_m\) of expected features before the audit. \(S_m\) are the mechanism-positive observations and \(F\) the observed failures. With \(\phi_j(x_i)\) the held-out SHAP attribution of feature \(j\), absolute attributions are averaged over a set \(A\) and normalized:
The three statistics are
Relevant share \(R_m\)
The share of attribution on mechanism \(m\)'s observations that falls on its expected features.
Differential score \(D_m\)
How much larger that share is on the mechanism's observations than on all other failures.
Outside-set excess \(C_m\)
How much the feature outside \(E_m\) with the largest gain increases its share. A significant excess names a feature to inspect.
Mechanism observations have extreme sensor values that receive large attributions even from a model that has learned nothing. Each statistic is therefore compared with \(K\) pipelines in which the failure labels are permuted and preprocessing, oversampling, training, cross-fitting and explanation are all repeated. For an observed value \(T\) and null values \(T^{(1)},\dots,T^{(K)}\),
After Holm correction across the four physical mechanisms (\(\alpha=0.05\)), a mechanism is flagged if \(C_m\) is significant, aligned if \(R_m\) and \(D_m\) are both significant, and not aligned otherwise.
Table 1. AI4I 2020 failure mechanisms, their trigger conditions, expected features \(E_m\), and number of mechanism-positive observations \(n\). L/M/H are product quality types.
| Mech. | Trigger | \(E_m\) | \(n\) |
|---|---|---|---|
| TWF | tool wear at a random point in 200–240 min | tool wear | 46 |
| HDF | (process − air temp.) < 8.6 K and speed < 1380 rpm | both temps., their difference, speed | 115 |
| PWF | torque × speed (rad/s) outside [3500, 9000] W | torque, speed, power | 95 |
| OSF | tool wear × torque above 11,000/12,000/13,000 min·Nm for L/M/H | tool wear, torque, overstrain, its ratio | 98 |
| RNF | 0.1% chance, independent of the process | – | 19 |
Alignment with failure mechanisms
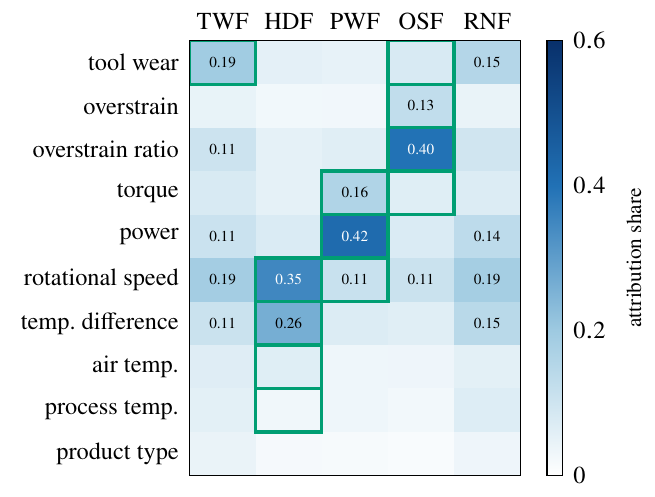
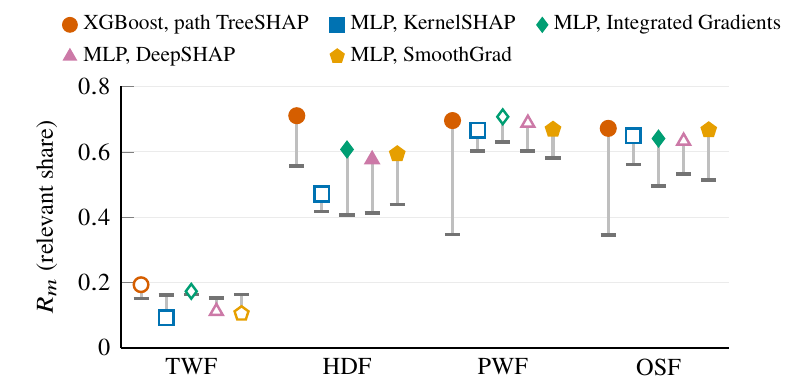
On the 34 test failures, tuned XGBoost reaches precision 1.00, recall 0.79 and F1 0.89. Its held-out attributions are compared with 1,000 shuffled-label pipelines. Heat dissipation, power and overstrain are aligned; tool wear is not.
Table 2. Primary audit using held-out SHAP values (seed 42, \(K=1{,}000\)). Null: mean over the shuffled-label pipelines; \(z\): (observed − null mean)/null s.d.; brackets: 95% bootstrap intervals conditional on the fitted models; \(p\): Holm-adjusted over the four physical mechanisms; grey: non-significant alignment test.
| \(n\) | Top feature | \(R_m\) [95% CI] | Null | \(z\) | \(p\) | \(D_m\) [95% CI] | Null | \(z\) | \(p\) | \(C_m\) | Null | \(p\) | Verdict | |
|---|---|---|---|---|---|---|---|---|---|---|---|---|---|---|
| TWF | 46 | tool wear | 0.193 [0.17, 0.22] | 0.152 | 0.9 | 0.201 | 0.129 [0.10, 0.16] | 0.070 | 1.5 | 0.077 | 0.025 | 0.025 | 1.000 | not aligned |
| HDF | 115 | speed | 0.711 [0.69, 0.73] | 0.557 | 3.4 | 0.004 | 0.431 [0.41, 0.45] | 0.049 | 8.4 | 0.004 | 0.001 | 0.015 | 1.000 | aligned |
| PWF | 95 | power | 0.696 [0.67, 0.72] | 0.347 | 7.6 | 0.004 | 0.330 [0.30, 0.36] | 0.088 | 5.7 | 0.004 | 0.001 | 0.011 | 1.000 | aligned |
| OSF | 98 | overstrain ratio | 0.672 [0.66, 0.69] | 0.345 | 5.6 | 0.004 | 0.424 [0.40, 0.44] | 0.067 | 7.0 | 0.004 | −0.001 | 0.019 | 1.000 | aligned |
| RNF | 19 | speed | 0.186 | 0.240 | – | 0.985 | – | – | – | – | – | – | – | – |
Why held-out explanations and a retrained null are needed
A classifier trained on shuffled labels fails the alignment tests. Compared with random failure observations instead, all four mechanisms appear significant, because mechanism observations have unusual sensor values that receive large attributions in any case. Explaining training observations is also too optimistic: in-sample SHAP passes all four mechanisms, including tool wear.
Table 3. Audit-component ablations on three selected diagnostic checks. “–”: no statistical result.
| Design | Rejects shuffled labels | Avoids in-sample TWF pass | Detects shortcut at 3·10⁵ |
|---|---|---|---|
| Global SHAP ranking | – | – | – |
| Naive null | No | No | No |
| In-sample SHAP | Yes | No | No |
| Relevant share \(R_m\) only | Yes | Yes | No |
| Full audit | Yes | Yes | Yes |
Robustness and the attribution reference
Each variant changes one part of the primary configuration and is compared with its own null. Seeds, single-mechanism observations and a null re-tuned on every permutation change nothing. Across five seeds \(R_m\) varies by at most 0.02. Removing the engineered features or using SMOTE removes HDF's relevant-share result, and removing each mechanism's most attributed trigger from \(E_m\) makes the audit flag the omitted feature.
Table 4. Verdicts for selected audit variants: ✓ aligned, × not aligned, ! flagged. All variants and Holm-adjusted \(p\)-values are in the supplement.
| Variant | \(K\) | TWF | HDF | PWF | OSF |
|---|---|---|---|---|---|
| Primary and null | |||||
| Primary audit | 1000 | × | ✓ | ✓ | ✓ |
| Seeds 1–4 (largest \(p\)) | 200 | × | ✓ | ✓ | ✓ |
| Null re-tuned per permutation | 500 | × | ✓ | ✓ | ✓ |
| Data and expected sets | |||||
| Raw features only | 1000 | × | × | ✓ | ✓ |
| Label = OR of flags | 200 | × | ✓ | ✓ | ✓ |
| \(E_m\) without top trigger | 200 | × | ! | ! | ! |
| Imbalance treatment | |||||
| Class weights | 200 | × | ✓ | ✓ | ✓ |
| Focal loss | 200 | ✓ | ✓ | ✓ | ✓ |
| SMOTE | 200 | × | × | ✓ | ✓ |
| Attribution (XGBoost) | |||||
| Interventional, training background | 200 | ✓ | ✓ | ✓ | ✓ |
| oversampled background | 200 | ✓ | ✓ | ✓ | ✓ |
| failure-only background | 200 | ! | × | × | ✓ |
| Pairwise, nearest normal | 200 | ✓ | ✓ | ✓ | ✓ |
| Conditional group Shapley | 200 | ✓ | ✓ | ✓ | ✓ |
| LIME | 200 | ✓ | ✓ | × | ✓ |
| Other models | |||||
| Random forest, path TreeSHAP | 200 | × | ✓ | ✓ | ✓ |
| MLP, KernelSHAP | 200 | × | × | × | × |
| MLP, Integrated Gradients | 200 | × | ✓ | × | ✓ |
| MLP, SmoothGrad | 200 | ! | ✓ | ✓ | ✓ |
| Sanity check | |||||
| Permuted labels | 200 | × | × | × | × |
Tool wear depends on the reference distribution
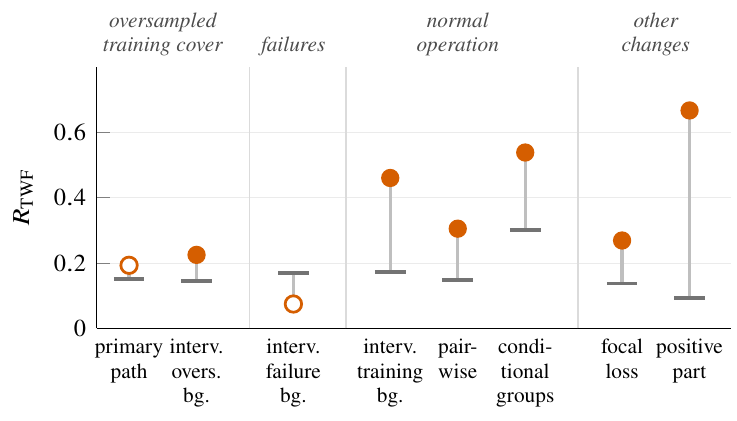
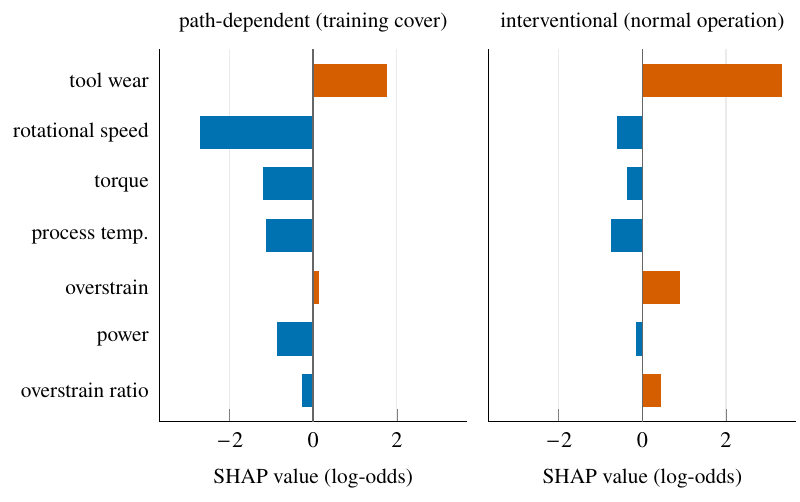
Tool-wear failure fails with path-dependent TreeSHAP but passes with interventional TreeSHAP for every background size and seed, and with every tested normal-operation reference. An oversampled interventional background also passes, but its share of 0.23 stays close to the path-dependent 0.19, and a failure-only background removes the alignment. Path-dependent TreeSHAP weights tree paths by the cover of the oversampled training data, which is balanced between failures and non-failures. Against this reference, ordinary operating values look like evidence against failure, and they dominate the absolute attribution of tool-wear observations, which the model rarely detects (recall 0.07). For questions about abnormal operation, we recommend a stated normal-operation reference.
Detecting planted shortcuts
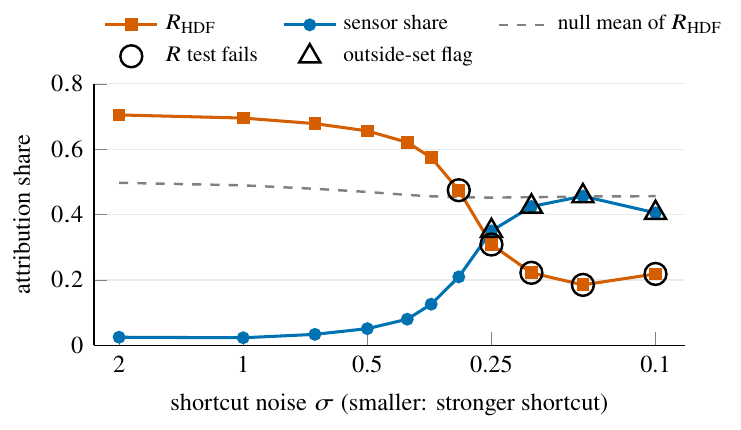
A sensor \(s_i=z_{i,\mathrm{HDF}}+\epsilon_i\), \(\epsilon_i\sim\mathcal{N}(0,\sigma^2)\), is a noisy copy of the heat-dissipation flag with no physical role. Weak shortcuts (\(\sigma\geq0.35\), at most 13% of HDF attribution) leave HDF aligned in this sweep, although \(\sigma=0.35\) removed the alignment in two of three generated datasets of the same size. A moderate one (\(\sigma=0.30\)) removes the alignment without naming a feature, and stronger ones (\(\sigma\leq0.25\), at least 35%) are flagged by the outside-set test, which names the sensor. Test F1 stays between 0.84 and 0.92 throughout. When the same signal is split over three sensors, they take 38% of the attribution together at \(\sigma=0.35\) but at most 14% each, and no feature is flagged until \(\sigma=0.25\).
Effect of sample size
On data generated from the documented AI4I process, the strong sensor is flagged in all ten runs, including at 300,000 observations, where the relevant-share test alone would pass. As the null narrows with more data, a model can beat the shuffled-label pipelines while relying heavily on a misleading feature, and only the outside-set test changes the result.
Table 5. Verdicts on generated data of increasing size (\(K=200\)): numbers of runs aligned (A), not aligned (N) and flagged (F). Share: planted sensor's share of HDF attribution; Min.: minutes per full audit on eight cores.
| \(n\) | \(\sigma\) | Runs | Share | HDF verdicts | TWF verdicts | Min. | ||||
|---|---|---|---|---|---|---|---|---|---|---|
| A | N | F | A | N | F | |||||
| 10,000 | none | 3 | – | 3 | 0 | 0 | 0 | 3 | 0 | 3 |
| 0.35 | 3 | 0.158 | 1 | 2 | 0 | 0 | 3 | 0 | 3 | |
| 0.25 | 3 | 0.390 | 0 | 0 | 3 | 0 | 3 | 0 | 3 | |
| 30,000 | none | 3 | – | 3 | 0 | 0 | 0 | 2 | 1 | 7 |
| 0.35 | 3 | 0.128 | 3 | 0 | 0 | 0 | 3 | 0 | 6 | |
| 0.25 | 3 | 0.346 | 0 | 0 | 3 | 0 | 2 | 1 | 7 | |
| 100,000 | none | 3 | – | 3 | 0 | 0 | 0 | 1 | 2 | 17 |
| 0.35 | 3 | 0.100 | 3 | 0 | 0 | 0 | 2 | 1 | 19 | |
| 0.25 | 3 | 0.315 | 0 | 0 | 3 | 0 | 2 | 1 | 19 | |
| 300,000 | none | 1 | – | 1 | 0 | 0 | 0 | 1 | 0 | 52 |
| 0.35 | 1 | 0.063 | 1 | 0 | 0 | 0 | 1 | 0 | 59 | |
| 0.25 | 1 | 0.271 | 0 | 0 | 1 | 0 | 0 | 1 | 61 | |
TWF flags at larger sizes fall on air or process temperature with excesses of 0.03–0.05, well below the planted shortcuts and omitted triggers (at least 0.165).
Bearing and process data
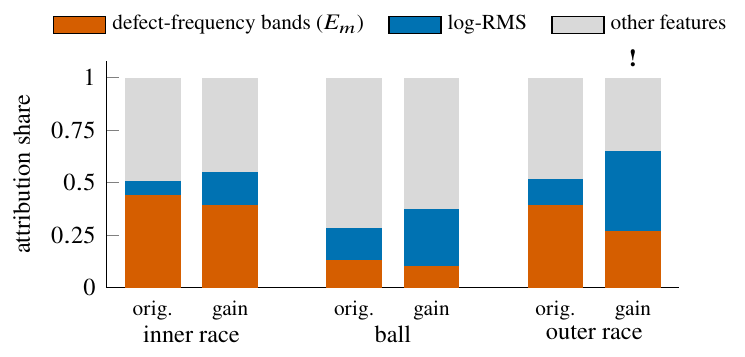
CWRU bearings. A random forest classifies the fault location of 36 laboratory recordings from 19 spectral features; \(E_m\) holds the spectral power around each fault's defect frequency. Inner- and outer-race attribution concentrates on the defect frequencies. When each recording's amplitude is scaled by a fault-dependent gain, every recording is still classified correctly, yet outer-race attribution moves to log-RMS and the outside-set test flags it.
Tennessee Eastman process. 400 simulated runs with a reactor (IDV4) or condenser (IDV5) cooling-water disturbance; \(E_m\) holds the three variables of the disturbed loop. IDV4 is aligned. IDV5 is flagged on the E-feed valve, which may be a downstream control response that the three-variable map does not cover; the data cannot separate this from a shortcut. A null that rotates each run's time-ordered labels gives the same verdicts.
Table 6. Audit on CWRU bearing data (\(K=1{,}000\)) and simulated Tennessee Eastman process data (\(K=200\)); Holm-adjusted \(p\). Grey: non-significant alignment test; red: significant outside-set test.
| Data | Fault | \(R_m\) | \(p\) | \(D_m\) | \(p\) | \(C_m\) | \(p\) | Verdict |
|---|---|---|---|---|---|---|---|---|
| CWRU | Inner | 0.440 | 0.004 | 0.190 | 0.030 | 0.065 | 1.000 | aligned |
| Ball | 0.133 | 0.773 | 0.036 | 0.211 | 0.051 | 1.000 | not aligned | |
| Outer | 0.392 | 0.003 | 0.131 | 0.027 | 0.042 | 1.000 | aligned | |
| + gain | Inner | 0.394 | 0.018 | 0.168 | 0.054 | 0.063 | 0.989 | not aligned |
| Ball | 0.105 | 0.948 | 0.029 | 0.547 | 0.020 | 0.989 | not aligned | |
| Outer | 0.269 | 0.018 | 0.050 | 0.547 | 0.165 | 0.006 | flagged | |
| TEP | IDV4 | 0.747 | 0.010 | 0.568 | 0.010 | 0.000 | 1.000 | aligned |
| IDV5 | 0.221 | 0.010 | 0.164 | 0.010 | 0.026 | 0.010 | flagged |
Practical guidance and limitations
Recommended defaults
- Fix \(E_m\) before the audit and explain only held-out observations.
- Refit the full pipeline for \(K\geq200\) shuffled-label nulls (\(K\geq500\) when an adjusted \(p\) lies near \(\alpha\); with \(M\) mechanisms, \(K\geq M/\alpha\)).
- Measure attributions against normal operation for questions about abnormal behaviour, and report the reference.
- Call a mechanism aligned only when both \(R_m\) and \(D_m\) pass, and report effect sizes with every verdict.
- Treat outside-set excesses at or below thresholds calibrated on independent no-shortcut runs (0.040 for \(C_m\), 0.109 for \(C^{(3)}_m\) in our generated data) as not actionable, recalibrate for new settings, and inspect every flag.
Limitations
- Results hold for a stated configuration and depend on the reference, the oversampler, engineered features, the model and explainer, and the expected sets.
- A flag alone cannot tell a missing trigger, a downstream effect and a shortcut apart.
- The outside-set test misses weak shortcuts and shortcuts spread over several sensors, and flags small excesses at large \(n\).
- AI4I and TEP are simulated and CWRU uses laboratory faults, so the audit shows agreement with documented rules and physics, not with verified causes in operating plants.
Code and reproduction
The repository contains the audit library, the 24 numbered experiment stages with their stored results, the tuned model, and the LaTeX sources. Seeds are fixed, and tables and figures are generated from the stored results.
git clone https://github.com/kowshik24/shap-mechanism-audit.git
cd shap-mechanism-audit
pip install -r requirements.txt -e .
python experiments/02_audit.py --quick   # primary AI4I audit with a tiny null
./reproduce.sh                           # every stage, tables, figures and both PDFs